%20(1)_edite.png)
Local Economic Indicators – Santa Cruz County
- Jane Aira Tan
- Jun 23, 2025
- 4 min read


Economy: Real Gross Domestic Product (GDP)
Real GDP reflects the total value of goods and services produced within Santa Cruz County and serves as a key measure of local economic health. Following a sharp contraction during the pandemic, the economy bounced back strongly in 2021 with a 7.9% increase. However, this momentum has since slowed, with a slight contraction in 2022 and modest growth of just 0.7% in 2023—bringing GDP to approximately $16.5 billion. These trends suggest a cooling economy that could impact job creation, consumer spending, and future tax revenues.

Economy: Inflation (Consumer Price Index - CPI-U)
The Consumer Price Index measures changes in the cost of everyday goods and services. Historically, the Bay Area has experienced higher inflation than the national average, mainly due to rising housing and energy costs. Inflation surged to 5.6% in 2022 before easing to 3.7% in 2023 and 2.8% in 2024. While inflation has cooled, it remains elevated compared to pre-pandemic levels, continuing to squeeze household budgets and public service operations.

Demographics: Population and Migration
Santa Cruz County’s population has declined by more than 8,700 residents since 2020, with the largest single-year drop—over 8,100 residents—occurring in 2021. This trend is driven primarily by net out-migration, as many residents left in search of more affordable housing or took advantage of remote work flexibility. The shift presents challenges for tax revenue, school enrollment, and long-term infrastructure planning.

Economy: Job Trends by Industry
As of early 2025, Santa Cruz County’s nonfarm employment grew by 1.0%, adding approximately 1,000 new jobs. Growth was led by Government, Education and Health Care, and Leisure and Hospitality sectors. Meanwhile, Construction, Retail, and Professional and Business Services saw declines—indicating ongoing challenges in consumer-driven and white-collar sectors. These dynamics affect workforce availability, service demand, and the County’s overall economic resilience.

Demographics: Age Distribution
More than half of Santa Cruz County’s population is aged 45 or older, while children under 15 represent less than 10%. This aging trend highlights a shrinking younger population, which has major implications for workforce sustainability, healthcare demand, and community planning over the coming decades.

Demographics: Racial and Ethnic Composition
The county remains majority White, but the White population has declined by more than 16,000 since 2010. The Latino population has grown steadily and now accounts for more than one-third of all residents. Asian and multiracial populations, while smaller in number, have also seen modest growth. These shifts emphasize the importance of inclusive, culturally responsive

Labor Market: Unemployment and Job Growth
As of February 2025, Santa Cruz County’s unemployment rate has risen to 7.3%, up from 4.8% the year before. Nonfarm job growth remains limited at just 1.0% year over year. This reflects a tightening labor market marked by economic uncertainty and industry-specific slowdowns. A growing mismatch between job openings and worker skills may increase demand for training programs and employment support services.

Labor Market: Long-Term Employment Trends
Since 2009, the county has experienced the strongest job growth in Health Care (+57%), Manufacturing (+53%), and Construction (+44%). In contrast, Retail Trade (-8%), Financial Activities (-12.4%), and Professional and Business Services (-2.7%) have lost jobs. These long-term shifts reshape the local economic base and provide guidance for workforce development and land use planning.

Labor Market: Government Employment
Government jobs make up a significant portion of local employment. In Santa Cruz County, 68% of government positions are at the local level, with 29% from the state and just 3% federal. Because of this, federal job cuts are unlikely to significantly impact the local labor market.

Labor Market: Wage Growth by Industry
Wage growth since 2009 has been highest in Manufacturing (+221%), Health Care (+147%), and Leisure and Hospitality (+144%)—highlighting demand for both skilled trades and frontline service roles. Meanwhile, wage increases have been more moderate in Retail (+37%), Government (+50%), and Professional and Business Services (+52%). These patterns affect overall cost of living and the County’s ability to attract workers, especially in lower-wage sectors.

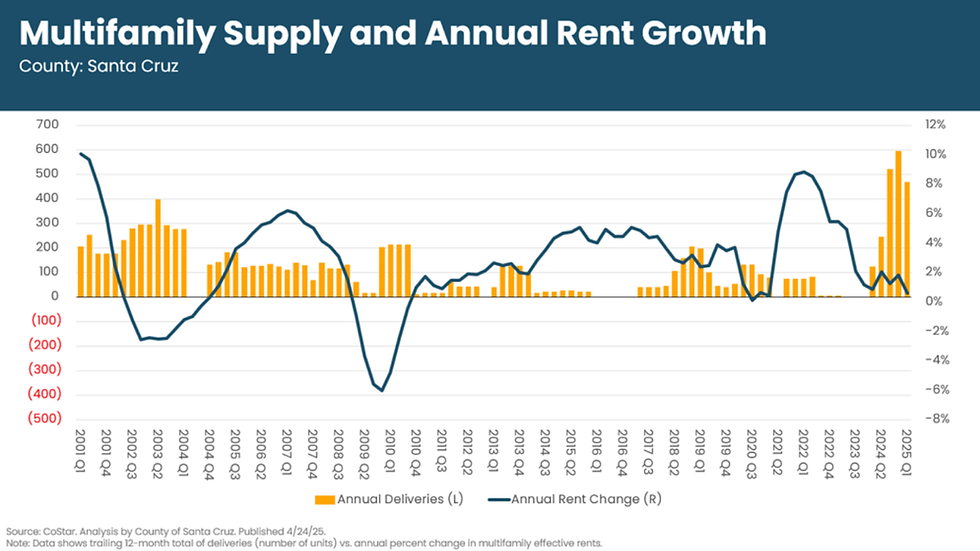
Housing: Multifamily Supply and Rent Growth
Apartment rents surged in 2021 and early 2022, with three straight quarters of annual growth exceeding 8%, while new apartment construction lagged behind. Since early 2024, 594 new units have come online—largely due to projects started during the post-pandemic low-interest rate period. This highlights the lag between rising demand and new supply, underscoring the
Housing: Single-Family Market Conditions
The median price for a single-family home in Santa Cruz County hit $1.42 million in April 2024, nearly triple the $495,000 recorded in 2010. Meanwhile, the unsold inventory index remains around 3%, well below the 5–6% considered a balanced market. This persistent supply-demand mismatch continues to drive up home prices and push more families into the rental market.

Commercial Real Estate: Vacancy Rates
As of Q1 2025, office vacancies have climbed to 9.6%, up from a post-pandemic low of 4.3% in 2019—driven by continued remote work trends. In contrast, industrial and retail spaces remain tight, with vacancy rates of 1.8% and 4.6%, respectively. Multifamily housing also remains in demand, with a vacancy rate of just 3.3%.

Commercial Real Estate: Property Mix by Use
Retail properties account for the largest share of commercial real estate in the county, with over 12 million square feet—nearly twice as much as office space. This reflects the county’s reliance on tourism, small businesses, and consumer services. Industrial and flex spaces also represent important segments of the market, influencing infrastructure needs and economic planning.

Tourism: Hotel Occupancy and Room Rates
The local tourism sector continues its recovery, with hotel occupancy rising from a low of 45.2% in February 2021 to over 66% as of early 2025. During the same period, average daily room rates have increased from $133 to more than $172. This rebound reflects strong visitor demand and supports jobs and local tax revenue through transient occupancy taxes.


Comments